I'm currently working on design development for a rural residential project, and I wanted information on how a clerestory would affect interior light levels, as well as passive solar heat gain. The client is looking for energy efficiency in this project, and as the designer I'm cognizant of daylighting concerns with the forested areas near the building footprint.
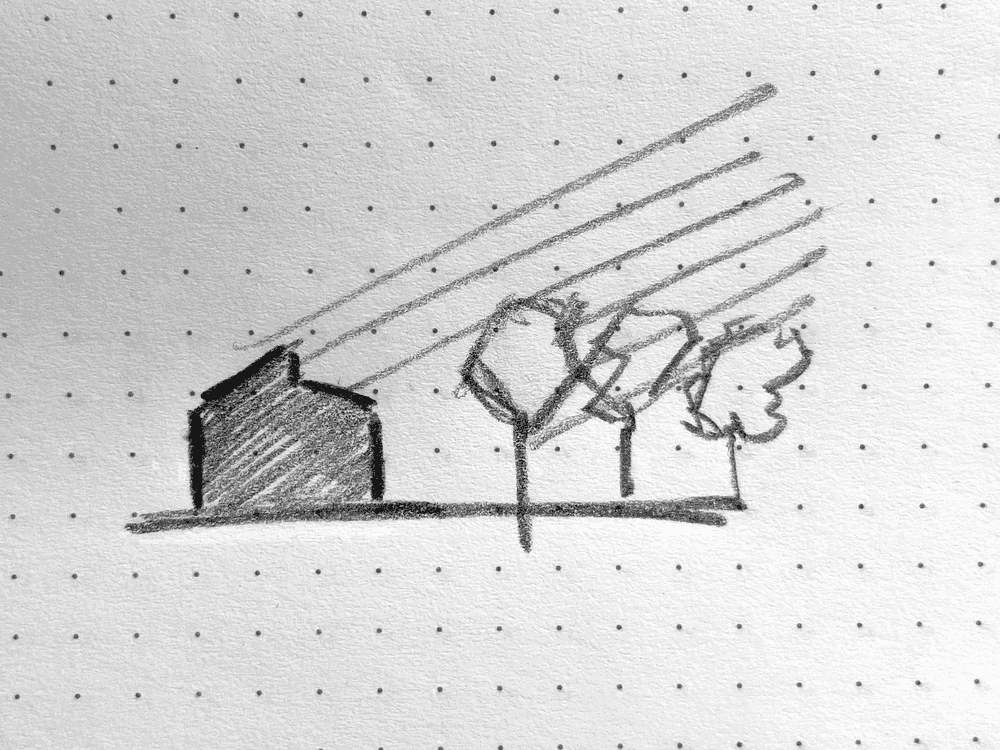
There are really two types of information we're looking for in terms of sunlight:
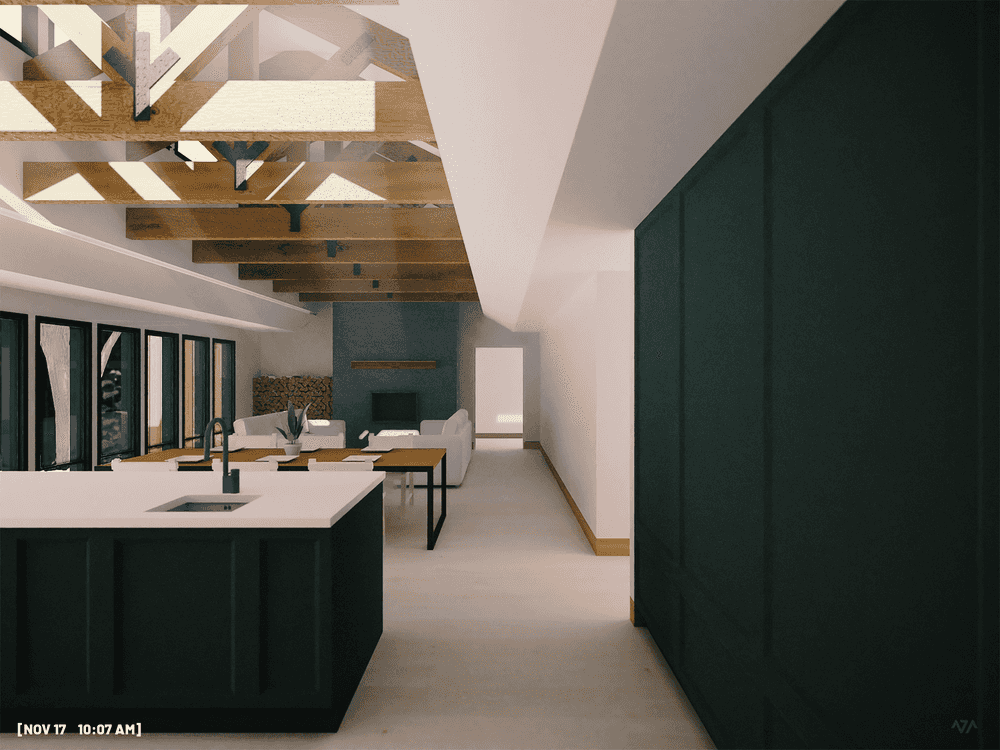
- Interior ray-traced renderings that give the client a good feel for the daylighting design goals.
- Actual calculated wattage values at arbitrary times during the year and day, so we can examine the shading performance over time and in different seasons or configurations. Actual values means I can make small tweaks to an overhang or window size, and compare 1:1 the impact on daylight coming through it. For my purpose I can examine if the proposed clerestory has a dramatic impact on solar gain or not.
For this post I'll focus on an approach to getting those irradiance values.
There are a couple of methods for getting this information: for example the spreadsheet approach of the Passivhaus PHPP, or the complex simulation method of something like energyPlus. Neither of these options is particularly appealing for my purposes:
- EnergyPlus is too complicated and time consuming for a small residential project, especially one in development phase where many aspects of the build haven't been fleshed out yet.
- PHPP abstracts the shading values to a calculated factor based on orientation and overhangs. This would work if I was looking at averages over a given year, or a design day/year, but once you get down to daily and hourly averages this approach breaks down. It also doesn't give me a clear sense of what I need to change to improve shading design.

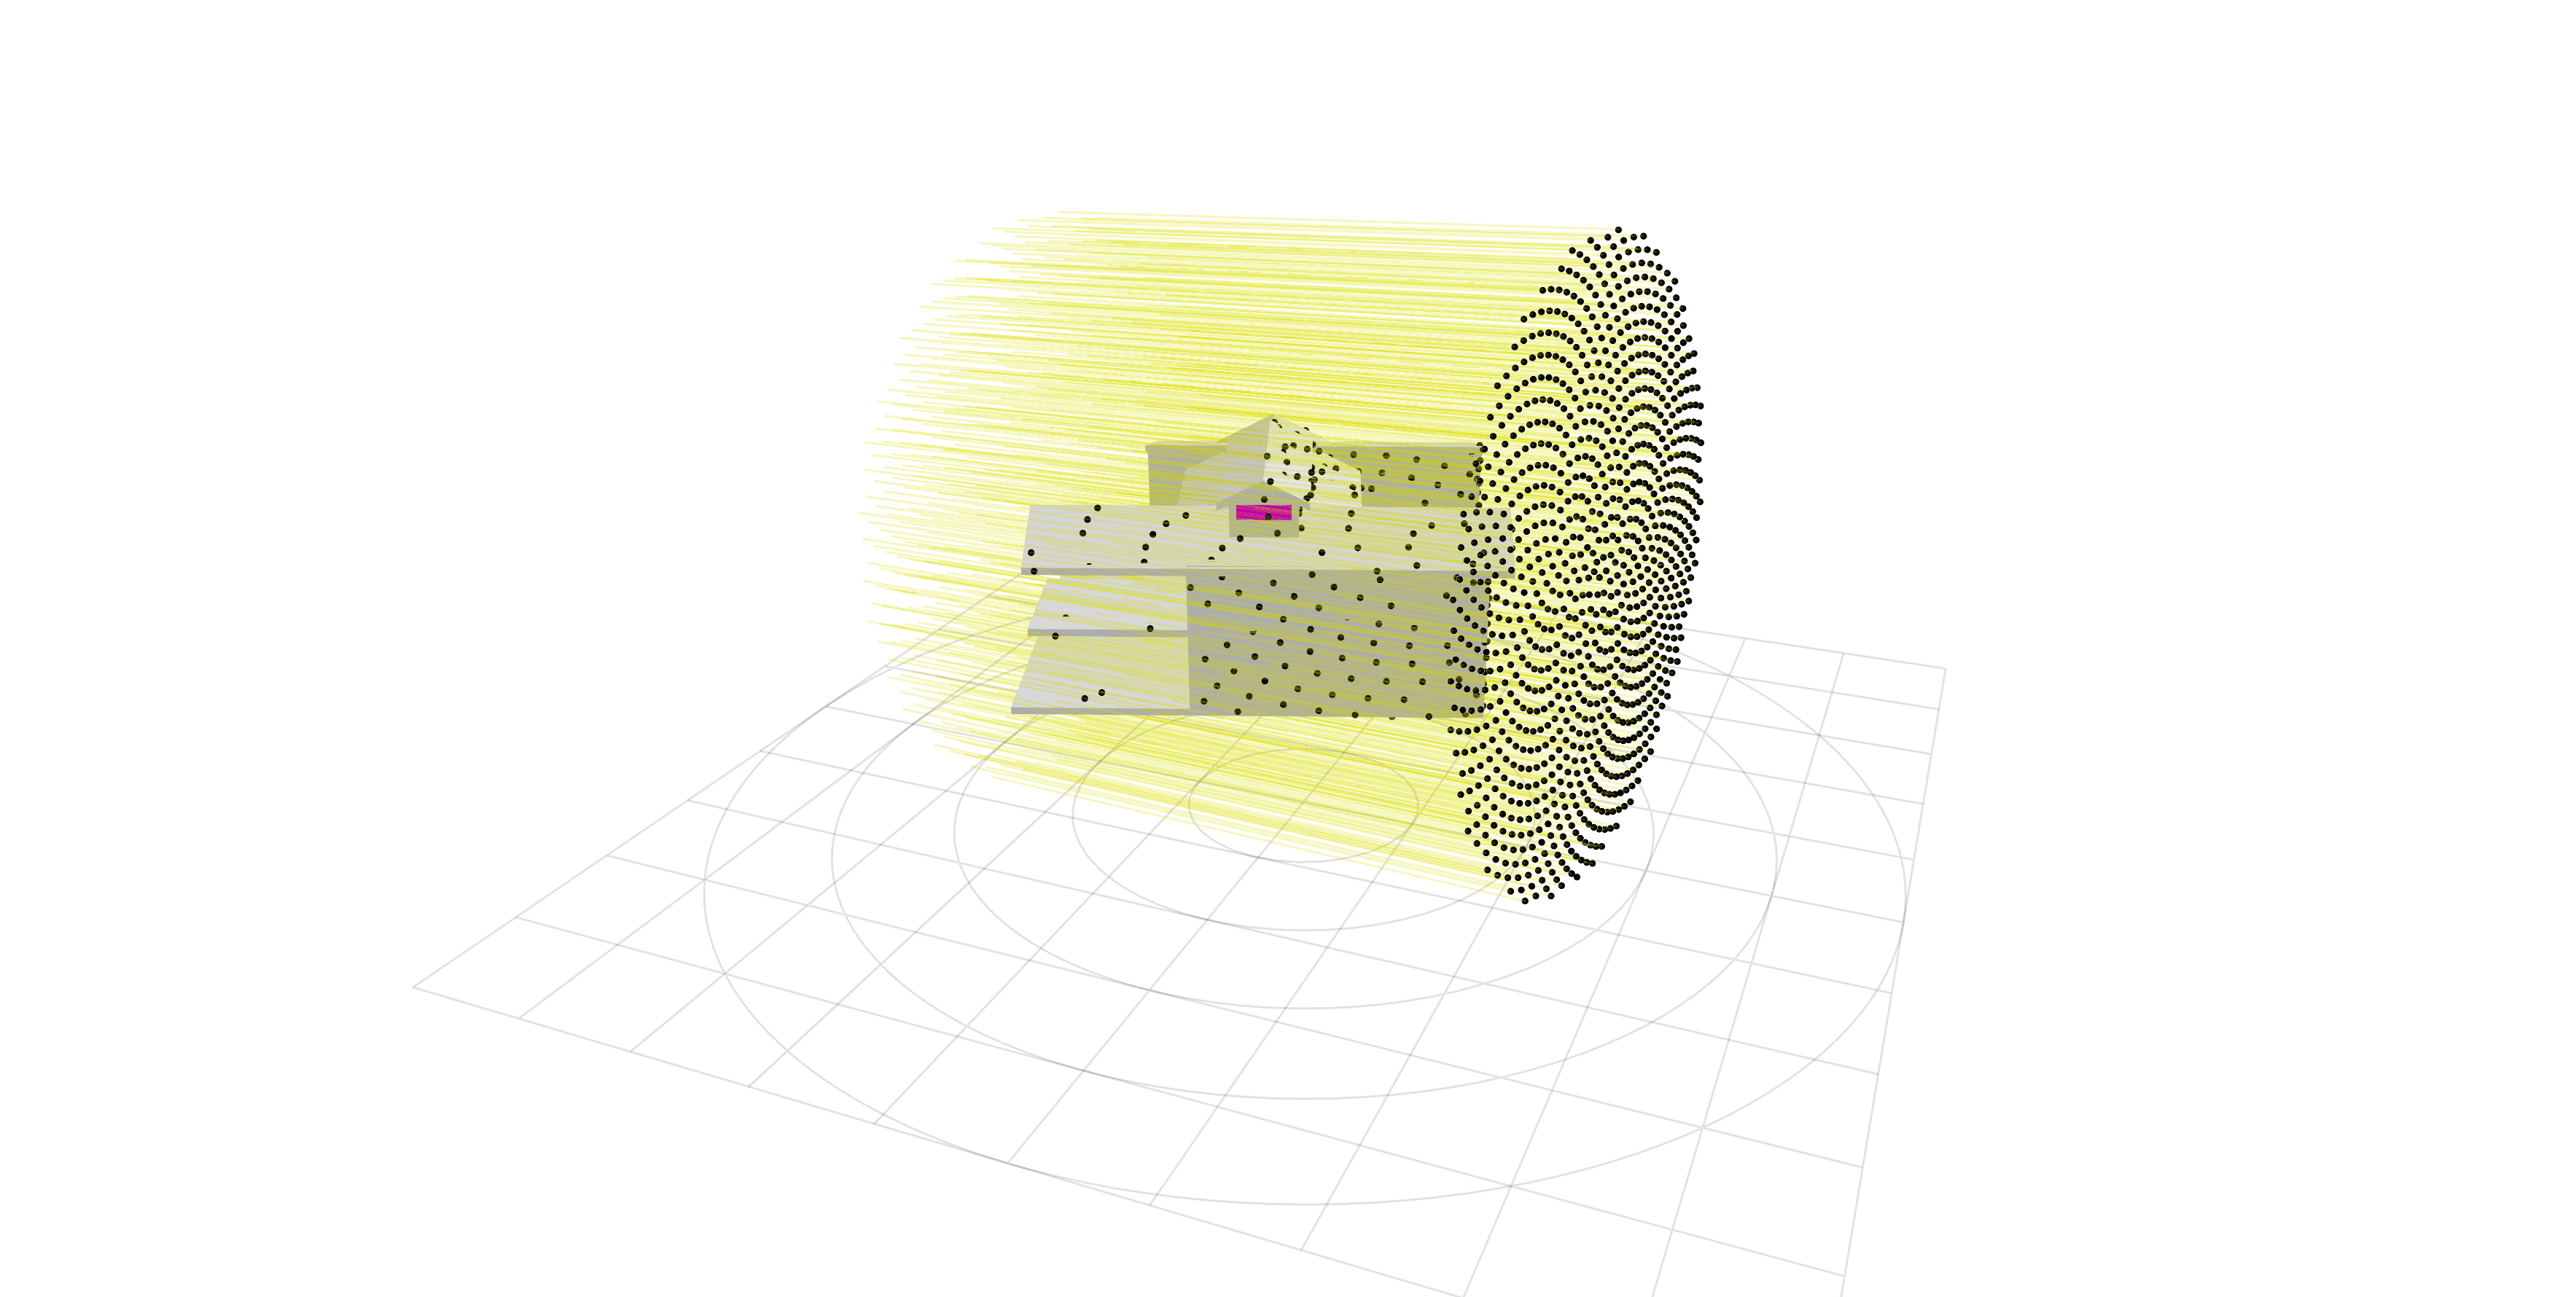
So instead I wrote a small program that could take in a simplified model of the building envelope I wanted to examine, and raytrace photons at any given time of day/year to give me realistic data on how each window individually contributed to solar gain for the building.
Getting a model to work with
From SketchUp I modelled a quick watertight mesh and coloured each face I wanted to track with a different color. From Python, I could pull in the exported Collada data and get the individual face colours per triangle to keep track of relevant surfaces.
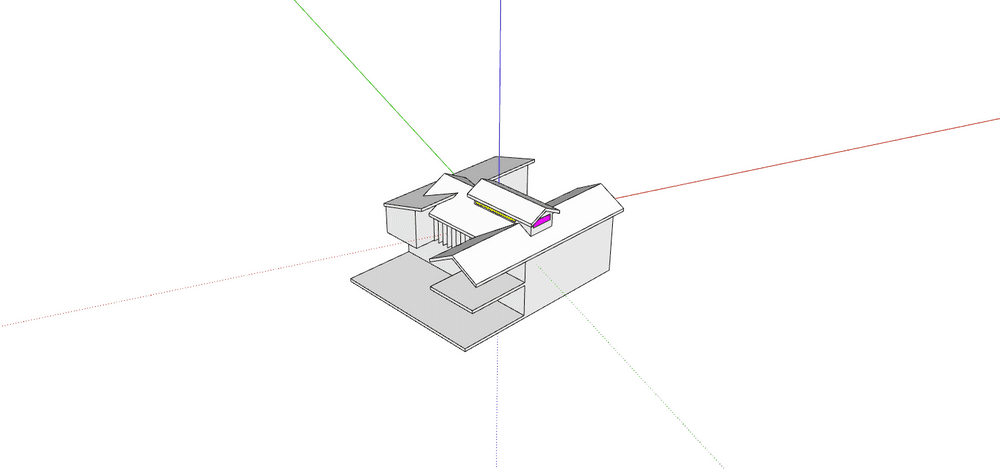
By the end of this project I ended up with a pretty extensive initialising loop rebuilding the mesh face by face because SketchUp structured the data weirdly for larger meshes and certain operations were inconsistent.
for geometry in scene.duplicate_nodes:
            geometry = geometry[0]
            face_color = scene.geometry[geometry].visual.to_color().vertex_colors
            face_id = get_ID_from_color(face_color)
            mesh = scene.geometry[geometry]

            if face_id not in assembly_builder.keys():
                assembly_builder[face_id] = {
                    'color': face_color,
                    'vertices': [vertex for vertex in mesh.vertices],
                    'faces': [face for face in mesh.faces]
                }
            else:
                for face in track(mesh.faces, description="Rebuilding mesh..."):
                    new_face = []
                    for ni, face_index in enumerate(face):
                        face_vertex = mesh.vertices[face_index]
                        for ei, existing_vertex in enumerate(assembly_builder[face_id]['vertices']):
                            if (existing_vertex[0] == face_vertex[0] and
                                existing_vertex[1] == face_vertex[1] and
                                existing_vertex[2] == face_vertex[2]):

                                new_face.append(ei)
                        if len(new_face) != ni-1: # The vertex isnt present in the existing list
                            new_face.append(len(assembly_builder[face_id]['vertices'])-1)
                            assembly_builder[face_id]['vertices'].append(face_vertex)
Getting solar azimuth and zenith
PVLib provides a method for getting this information, so I start by filling a dataframe with hourly info on the solar elevation and zenith.
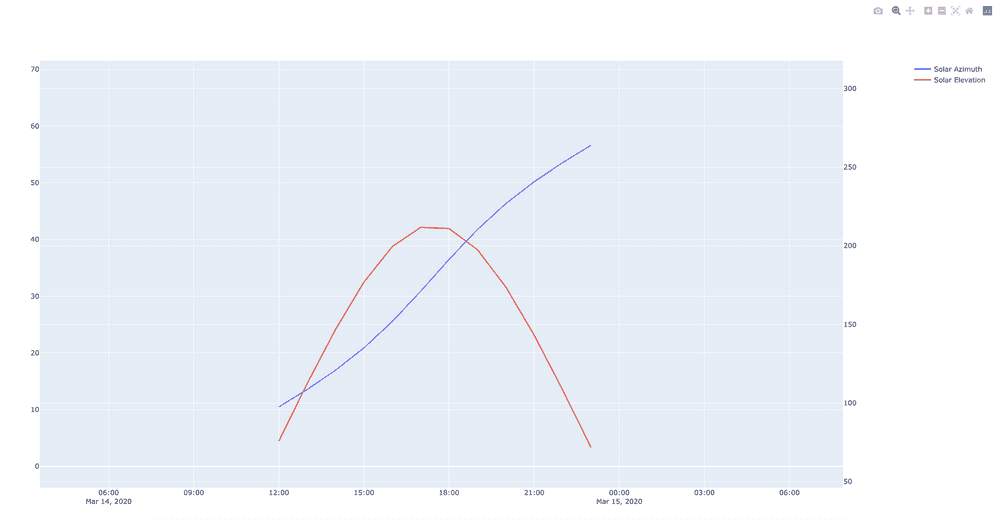
From there I use a bit of math to get a vector position for the sun.
self.origin = np.array([
            radius*np.sin(z_rad)*np.cos(a_rad),
            radius*np.sin(a_rad)*np.sin(z_rad),
            radius*np.cos(z_rad)
        ])

self.normal = normalize_vector(np.array([
    -np.sin(z_rad)*np.cos(a_rad),
    -np.sin(a_rad)*np.sin(z_rad),
    -np.cos(z_rad)
]))
As a brute force approach, I cast rays out from a disk oriented from the sun position, the diameter of which matches the bounding sphere for the model. By using the bounding sphere, I can orbit the raycasting object arbitrarily around the origin while guaranteeing that I won't start missing the model entirely. The spiral pattern is from a fibonacci spiral that keeps the points evenly spaced on the disk. If the points were distributed on a simple lattice, I wouldn't be able to divide their individual rays by the total area of the circle.
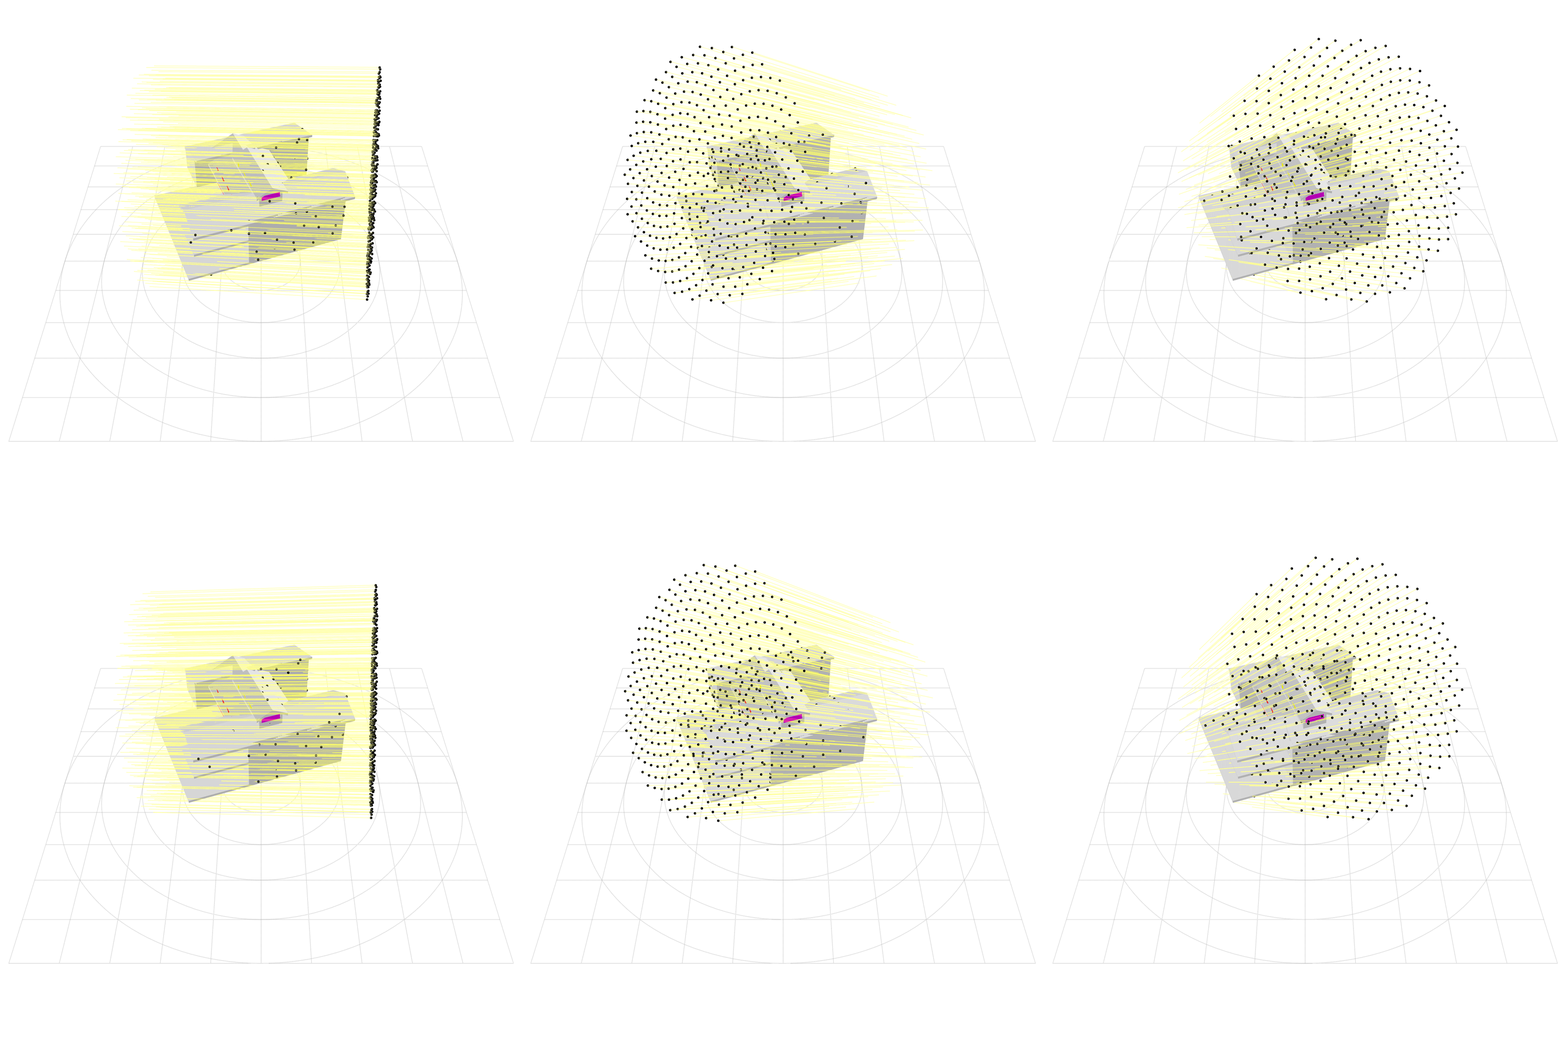
This technique is not very clever, and lends itself to tracking larger regions of the model for accuracy, but is suprisingly effective at giving actual values for incident radiation.


I'd like to improve the program and maybe set the repository to public once I've cleaned it up and rewritten it to parallelise the processing. Here are my current list of improvements to make:
- Azimuth-based radar chart visualisation of incident radation on each component so the shading design can be attacked more directly.
- Comsposability for simulation processes. Having hacked this program together as a draft attempt, I can see that you can feed child processes just information about the current and maybe previous simulation frames and get a response, instead of the entire dataframe which could introduce a race condition if I try to parallelise this.
- Arbitrary time resolution and range. Automatically up or downsample data to avoid
having to hardcode the
df.head(100)over and over to test changes. - A bunch of other improvements, I'll hopefully post an update if I have time to do a rewrite.
